
Hello !!
Many people think ECG interpretation is hard i will take you through the basics of it.
To understand how to interpret the ECG you must first understand the basics which is out of the scope of this scope.
To interpret an ECG the following are the most important:
1. Understanding the basics
2. Systematic approach for interpretation
SOME BASICS
ECG WAVEFORMS
- What do the waves represent ?

Adapted from: https://meds.queensu.ca/central/assets/modules/ts-ecg/waves_and_complexes.jpg
WAVES AND INTERVALS PICTORIAL REPRESENTATION

Adapted from: https://ecgwaves.com/topic/ecg-normal-p-wave-qrs-complex-st-segment-t-wave-j-point/
- What do the boxes represent ?
Each small box in the ECG paper is 1 mm = 0.1 mV = 0.04 secs
Each large box in the ECG paper is 5mm = 0.5 mV = 0.20 secs (0.04 X 5)
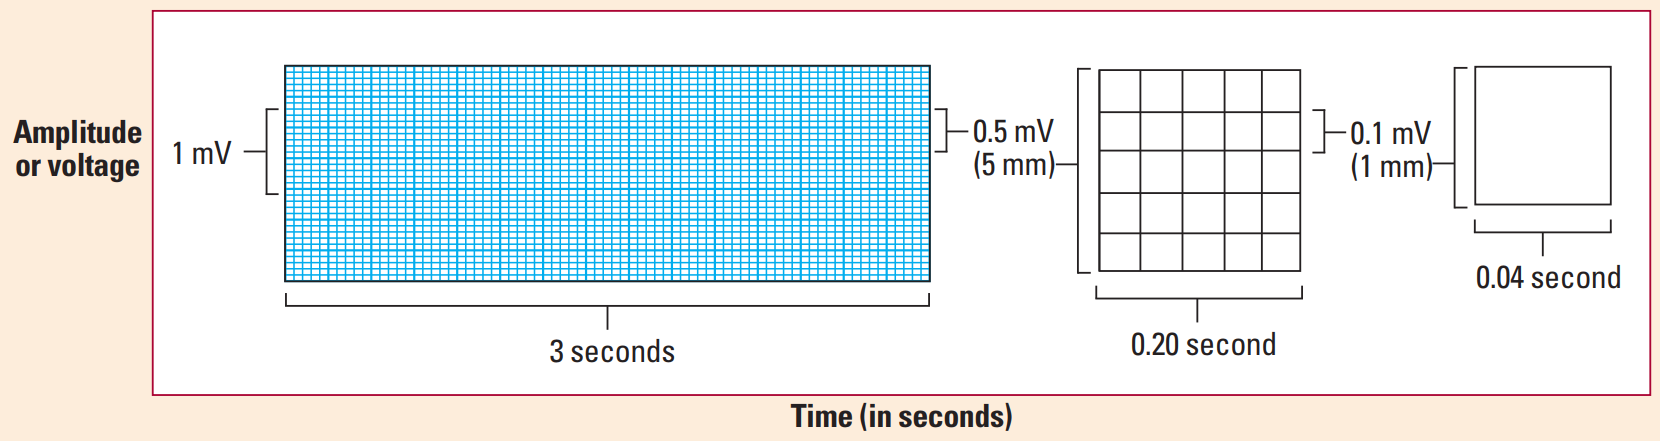
Adapted from: ECG interpretation made incredibly easy —5th ed
SYSTEMATIC INTERPRETATION
1. Heart rhythm
- Use paper and pencil/pen method for determination of the heart rythm
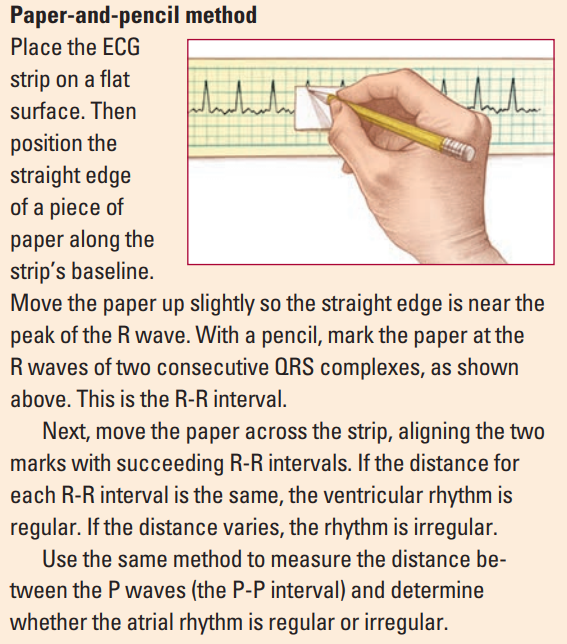
Adapted from: ECG interpretation made incredibly easy —5th ed
- Determine whether it is a sinus rhythm ? (in which each QRS complex is preceded by a p wave)
- Determine whether the rhythm is regular or not:
- Types of rhythms:
a. Regularly regular rhythm: In a normal individual
b. Regularly irregular rhythm: Sinus arrhythmia
c. Irregular irregular rhythm: Atrial fibrillation
2. Heart Rate
- Atrial rate : between 2 P waves
- Ventricular rate : between 2 R waves
- Can be calculated depending on whether the rhythm is regular or irregular
- If the rhythm is regular the following methods can be used:
a. 300 method
In this take 300 divided by number of large boxes between 2 R waves
Example: If the number of boxes between 2 R waves is 3 then the Rate would be 300/3 = 100 beats/min.
b. 1500 method
In this take 1500 divided by the number of small boxes between 2 R waves
Example: If the number of boxes between 2 R waves is 14 then the Rate would be 1500/14 = 107 beats/min.
c. Rapid estimation method
Use this only if the rhythm is regular
Using the number of large boxes between R waves or P waves as a guide, you can rapidly estimate ventricular or atrial rates by memorizing the sequence “300, 150, 100, 75, 60, 50.”

For an Irregular rythm:
- Use the rythm strip / Lead II and count the number of R waves in 6 seconds (30 large boxes ) and multiply by 10.
- Use the rythm strip / Lead II and count the number of R waves in 6 seconds (30 large boxes ) and multiply by 10.
3. Cardiac Axis
- Determined using lead I and II / aVF
- Determine the cardiac axis : the easiest way is to use the thumb rule
- Left thumb represents lead 1
- Right thumb represents lead 2 or lead aVF

- Mnemonics for the causes of axis deviation RAD RALPH the LAD from the VILLA
RAD - Right axis deviation causes
R- Right ventricular hypertrophy
A- Anterolateral MI
LPH- Left posterior hemiblock
LAD - Left axis deviation
V- Ventricular tachycardia
I- Inferior MI
L- Left ventricular hypertrophy
LA- Left Anterior fascicular block
4. Evaluate P wave
- P waves should be upright in leads I and II, inverted in aVR
- Are p waves present before every QRS complex? if yes; sinus rhythm
- P waves may be absent in; atrial fibrillation
- Normal P wave : <0.10 sec (2.5 small boxes)
- Common Abnormalities of P wave
Bifid/notched P waves (p mitrale) : Left atrial enlargement - classically due to mitral stenosis
Peaked P waves (p pulmonale) : Right atrial enlargement - due to Pulmonary Hypertension
5. Duration of PR interval
- The PR interval is the time from the onset of the P wave to the start of the QRS complex
- It reflects conduction through the AV node
- Normal duration : 3-5 small boxes (0.12 to 0.20 secs)
- Determine if the duration is normal
- Common abnormalities of PR interval
a. Can be prolonged in: AV block
b. Can be short in: Pre-excitation syndromes e.g in Wolff-Parkinson-White syndrome; which involve the presence of an accessory pathway connecting the atria and ventricles.The accessory pathway conducts impulses faster than normal, producing a short PR interval.
6. Duration of the QRS complex
- Normal duration : 2-3 small boxes (0.08-0.12 secs)
- Determine if the duration is normal
- Are all QRS complexes of same size and shape ?
- Does a QRS complex appear after every p wave ? if not consider an AV block (second degree AV block); in which the PR-interval progressively gets longer until a QRS is dropped and only the p-wave is present
- Common abnormalities of QRS complex
a. QRS deflections; Exaggerated QRS deflections indicate ventricular hypertrophy
- The voltage criteria for left ventricular hypertrophy are fulflled when the sum of the S and R wave deflections in leads V1 and V6 exceeds 35 mm (3.5 mV) ( 7 large boxes )
- Right ventricular hypertrophy causes tall R waves in the right ventricular leads (V1 and V2)
- Diminished QRS deflections occur when pericardial effusion or obesity electrically insulates the heart
b. Narrow QRS complex morphology (<0.08 secs)
- Atrial flutter
- Junctional tachycardia
- Note : normal sinus rhythm also has a narrow QRS complex morphology
c. Broad/wide complex QRS complex morphology (>0.12 secs)
- Bundle branch block (BBBB) : LBBB or RBBB
- Hypokalemia
- Poisoning with sodium-channel blocking agents (e.g. tricyclic antidepressants) - remember this also gives you a dominant R wave in lead avR.
7. ST segment
- The ST segment is the flat, isoelectric section of the ECG between the end of the S wave and the beginning of the T wave.
- It represents the interval between ventricular depolarization and re polarization.
- The most important cause of ST segment abnormality (elevation or depression) is myocardial ischemia or infarction.
The causes of ST elevation can be remembered using the mnemonic ELEVATION
Electrolyte abnormalities
Left bundle branch block
Aneurysm of left ventricle
Ventricular hypertrophy
Arrhythmia disease (Brugada syndrome, ventricular tachycardia)
Takotsubo/Treatment (iatrogenic pericarditis)
Injury (myocardial infarction/ischaemia or cardiac contusion)
Osborne waves (hypothermia or hypocalcemia)
Non-atherosclerotic (vasospasm or Prinzmetal’s angina)
The causes of ST depression can be remembered using the mnemonic DEPRESSED ST
Drooping valve (MVP)
Enlargement of LV with strain
Potassium loss (hypokalemia)
Reciprocal ST- depression (in I/W AMI)
Embolism in lungs (pulmonary embolism)
Subendocardial ischemia
Subendocardial infarct
Encephalon haemorrhage (intracranial haemorrhage)
Dilated cardiomyopathy
Shock
Toxicity of digoxin, quinidine
8. Evaluate T wave
It represents ventricular repolarisation
NB:
Upright in all leads except aVR and V1
Amplitude <5mm (5 small boxes) in limb leads, <15mm (3 large boxes) in precordial leads
- Are T waves present ?
- Do they have normal shape ?
- Do they have normal amplitude?
- Do they have same deflection as QRS complexes ?
- Common T wave abnormalities
a. Inverted T wave
- Can be remembered by the mnemonic INVERT
Ischemia, raised ICP
Normality [esp. young, black]
Ventricular hypertrophy
Ectopic foci [e.g. calcified plaques], classic pulmonary Embolism
RBBB, LBBB
Treatments [digoxin]
b. Tall/peaked T waves
- Classically seen in Hyperkalemia
c. Hyperacute T waves
- Seen in early stages of ST elevation MI (STEMI)
d. Biphasic T waves
-Ischaemic T waves go up then down
-Hypokalaemic T waves go down then up
e. Flat T wave
- Ischaemia
- Hypokalemia
9. Determine the duration of the QT interval
QT interval : is the time from the start of the Q wave to the end of the T wave. It represents the time taken for ventricular depolarisation and repolarisation, effectively the period of ventricular systole from ventricular isovolumetric contraction to isovolumetric relaxation
- QT interval is inversely proportional to heart rate i.e as the HR increases the QTi decreases and vice versa
- The QT interval should be measured in either lead II or V5-6
- Determine if the QT interval is normal ? (normal = 0.36 to 0.44 secs = 9-11 small boxes)
- Corrected QT interval (QTc)
-- Due to the variations of the heart rate : The corrected QT interval estimates the QT interval at a heart rate of 60 bpm.
-- The following formula can be used to calculate the QTC = QT interval / √ RR interval (Bazzet's formula)
-- RR interval = 60/Heart rate
-- Note: there are many formulas which can be used for calculation of but this is probably the easiest one.
-- QTc is prolonged if > 0.44 secs in men or > 0.46 secs in women
-- QTc > 500 is associated with increased risk of torsades de pointes
- Causes of prolonged QTc > 0.44 secs
Hypokalaemia
Hypomagnesaemia
Hypocalcaemia
Hypothermia
Myocardial ischemia
Post-cardiac arrest
Raised intracranial pressure
Congenital long QT syndrome
Drugs - quinidine, amiodarone, TCA's
- Causes of a short QTc < 0.36 secs
Hyperkalemia
Hypercalcaemia
Congenital short QT syndrome
Digoxin effect
The End !!
Please note that this is not everything that you need to know , and this article doesn't cover everything about the ECG, it just covers the basics and the most common abnormalities that can be found on an ECG.
But for sure ! It has just enough information which can help anyone understand and interpret and ECG.
Mohammad Farouq,
Final year medical student, MUHAS.
Can you explain the thumb rule properly...
ReplyDeleteIt's good to know so many mnemonic and really helpful
ReplyDeleteIt's nice and really helpful
ReplyDeleteItx very helpful🙏🤝
ReplyDeleteCant stop clapping Dr Mohammed Faruk. Thank you.
ReplyDelete